Wireless Statistics: Difference between revisions
Jump to navigation
Jump to search

No edit summary |
No edit summary |
||
| Line 5: | Line 5: | ||
[[File:Login-1-768x352.png|frame|center]] | [[File:Login-1-768x352.png|frame|center]] | ||
* Step Two: After logging into the controller, click ‘Insights’ on the left side of the screen. | * Step Two: After logging into the controller, click ‘Insights’ on the left side of the screen. | ||
| Line 10: | Line 11: | ||
[[File:Insights 2.png|frame|center]] | [[File:Insights 2.png|frame|center]] | ||
* Step Three: The screen will change and you will now have a drop-down menu in the top left corner. Change this by selecting ‘Past Connections’ from that drop-down options if it is not already. | * Step Three: The screen will change and you will now have a drop-down menu in the top left corner. Change this by selecting ‘Past Connections’ from that drop-down options if it is not already. | ||
[[File:Past connections-1-768x351.png|frame|center]] | [[File:Past connections-1-768x351.png|frame|center]] | ||
* Step Four: Select the date range you wish to view using the date menu at the top-left. It is usually defaulted to ‘Last 24 Hours’. | * Step Four: Select the date range you wish to view using the date menu at the top-left. It is usually defaulted to ‘Last 24 Hours’. | ||
| Line 20: | Line 21: | ||
[[File:Date range 1-1-768x351.png|frame|center]] | [[File:Date range 1-1-768x351.png|frame|center]] | ||
* Step Five: You can select a custom date range from the calendar drop-down or choose on of several predefined ranges including ‘Last Year’ for state reports. Click ‘Apply’ (green button) when finished. When selecting a yearly total, it may take a minute for the screen to count up the connections. | * Step Five: You can select a custom date range from the calendar drop-down or choose on of several predefined ranges including ‘Last Year’ for state reports. Click ‘Apply’ (green button) when finished. When selecting a yearly total, it may take a minute for the screen to count up the connections. | ||
[[File:Date range 2-1-768x353.png|frame|center]] | [[File:Date range 2-1-768x353.png|frame|center]] | ||
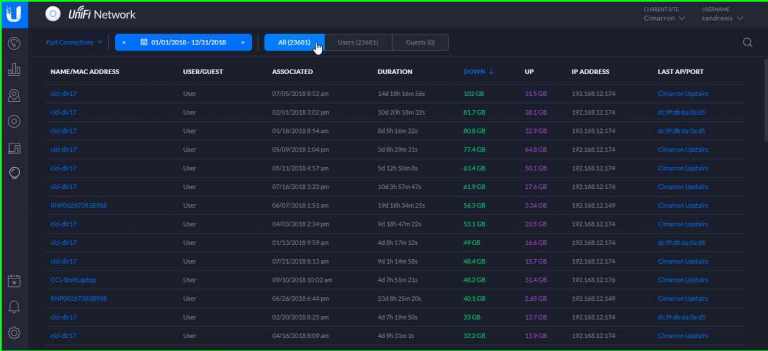
* Step Six: After changing the date range, the total connections will appear at the top. In this example, the number in parentheses next to ‘All’ is the total (23681). | * Step Six: After changing the date range, the total connections will appear at the top. In this example, the number in parentheses next to ‘All’ is the total (23681). | ||
[[File:Total-768x351.png|frame|center]] | [[File:Total-768x351.png|frame|center]] | ||
Revision as of 21:02, 16 June 2020
Unifi Controller Wireless Statistics
A quick overview on getting wireless statistics from the Unifi wireless controller (click on images for larger size).
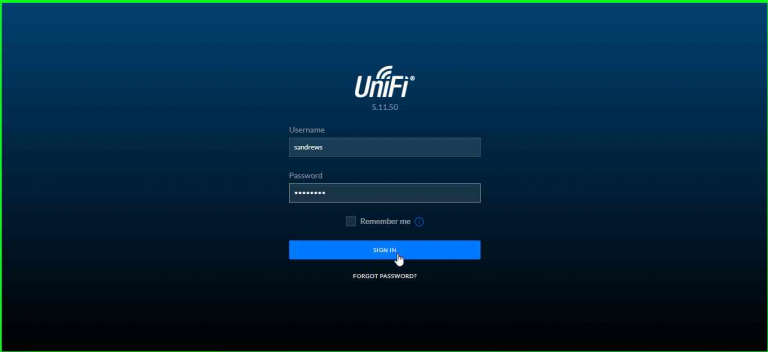
- Step One: Login to the wireless controller (https://unifi4.swkls.org:8443/manage). You can only access this page from your library network! if you cannot remember your login credentials, please contact the system office.

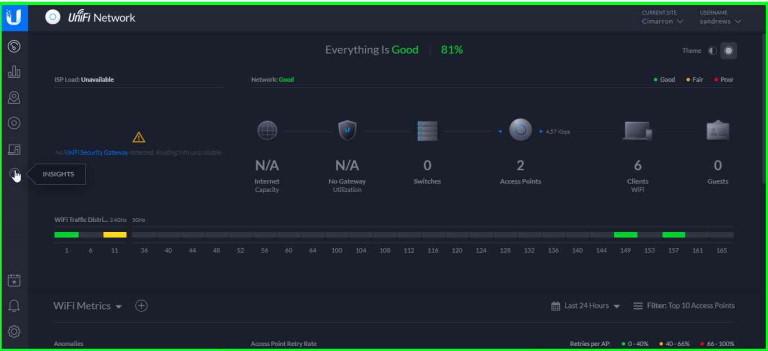
- Step Two: After logging into the controller, click ‘Insights’ on the left side of the screen.

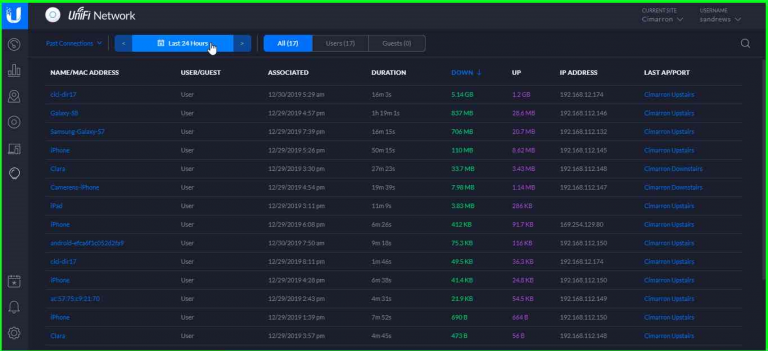
- Step Three: The screen will change and you will now have a drop-down menu in the top left corner. Change this by selecting ‘Past Connections’ from that drop-down options if it is not already.

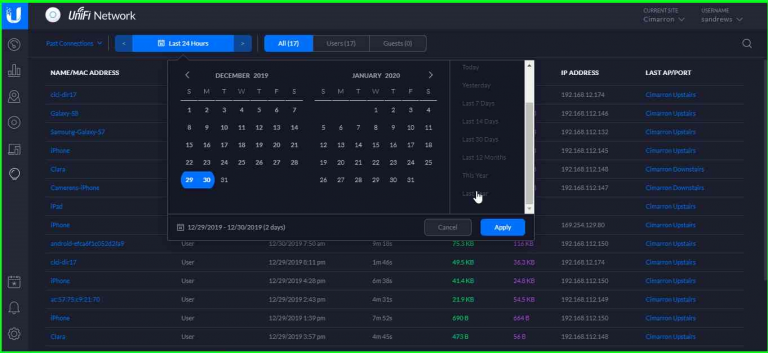
- Step Four: Select the date range you wish to view using the date menu at the top-left. It is usually defaulted to ‘Last 24 Hours’.

- Step Five: You can select a custom date range from the calendar drop-down or choose on of several predefined ranges including ‘Last Year’ for state reports. Click ‘Apply’ (green button) when finished. When selecting a yearly total, it may take a minute for the screen to count up the connections.

- Step Six: After changing the date range, the total connections will appear at the top. In this example, the number in parentheses next to ‘All’ is the total (23681).
